Amazon Ads Performance Metrics
Struggling to maximize your Amazon PPC budget? Analyzing key metrics like click-through rates, conversion rates, and ACoS holds the key to enhancing campaign performance.
Monitoring performance is important to see where your budget is being spent and minimize inefficiencies. Read on to learn how to effectively track and analyze Amazon PPC data for maximum profitability.
How to Track Amazon PPC Results
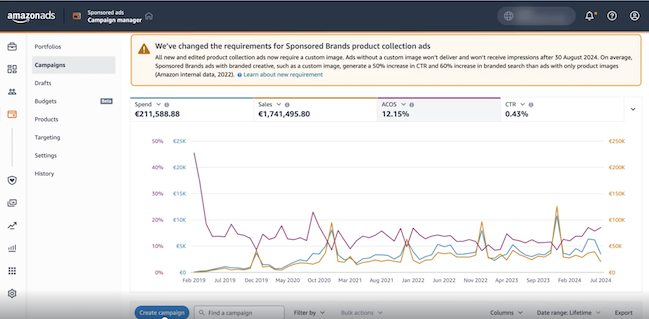
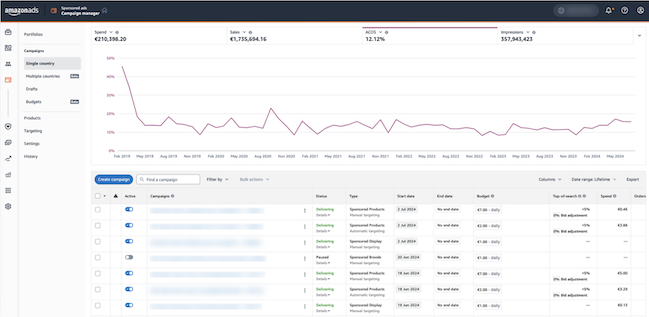
Monitoring key metrics in the Amazon Ads console helps ensure ad spending aligns with sales goals. You can view individual metrics or combined data to gain a holistic understanding of performance. The Amazon Ads console allows you to track metrics like:
- Spend: The amount spent on advertising
- Sales: The sales generated from ads
- ACoS (Advertising Cost of Sale): The ratio between ad spend and sales, indicating the efficiency of your campaign.
Tools for Analyzing Amazon PPC Data
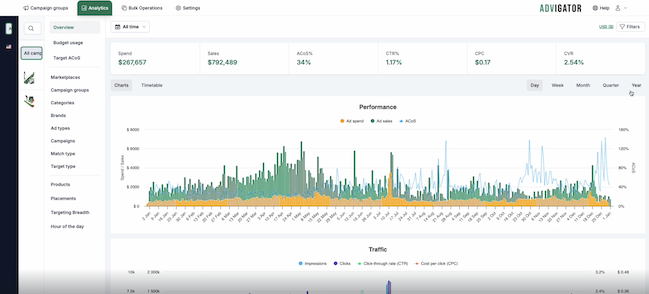
Tools like Advigator simplify sales performance tracking. They display key metrics like spend, sales, and ACoS in one chart, with options to view data by product or region and switch between daily, weekly, or monthly views.
ACoS
ACoS (Advertising Cost of Sales) is a key metric used by Amazon sellers to measure the efficiency of their advertising campaigns. It represents the ratio of ad spending to the revenue generated from those ads. Understanding ACoS can help you evaluate how well your advertising investments are performing.
ACoS Formula
Formula for ACoS
The formula to calculate ACoS is:
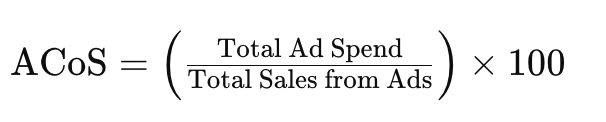
This gives you ACoS as a percentage.
How to calculate ACoS
Let’s go through a simple example:
- Total Ad Spend: $100
- Total Sales from Ads: $500
Using the formula:
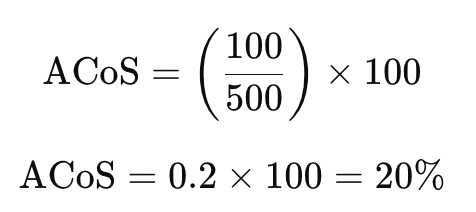
20% ACoS: This means that for every dollar you earn in sales from your ads, you are spending 20 cents on advertising.
What’s a Good ACoS?
The ideal ACoS varies by profit margins and campaign goals. A lower ACoS typically means better profitability, but during product launches, a higher ACoS may be fine because the main goal is increased visibility.
Analyze ACoS monthly to get a clearer picture of performance.
In the most recent period, the AcoS is usually higher because orders have yet to be attributed to the campaign, as the customer has 7 days to place orders. So we suggest you look at the ACoS as a total value over a monthly period.
Break-Even ACoS
Break-even ACoS occurs when your ad spend matches your sales revenue.
How to Calculate Break-Even ACoS
First, calculate your profit margin (Sale Value - Item Cost) and compare it to your ACoS.
The goal is for your profit margin to be higher than your ACoS. If your ACoS exceeds your profit margin, you’re losing money. To break even, you can reduce item costs like shipping, manufacturing, or warehousing. Our ACoS calculator can help with quick calculations.
Lowering ACoS
- Optimize Product Pages: Ensure pages are clear and compelling
- Target the Right Keywords: Focus on high-performing, relevant keywords
- Set Appropriate Bids: Avoid over-bidding by adjusting bid amounts based on performance
TACoS
Total Advertising Cost of Sale (TACoS) measures the ratio of ad spend to total revenue, providing a broader view than ACoS. It helps assess overall profitability and the impact of ads on organic sales and is useful for scaling, product launches, and keyword rankings.
How to Calculate TACoS
TACoS = (Total Ad Spend / Total Sales Revenue) * 100
Regular calculation is key. An increasing TACoS indicates the need to boost organic sales, while a decreasing TACoS suggests ads are effective in increasing organic growth.
TACoS vs. ACoS
- ACoS (Advertising Cost of Sales): Measures ad efficiency by showing the return on ad spend (Ad Spend / Ad Revenue)
- TACoS: Takes a broader view, showing how ads impact both paid and organic sales (Ad Spend / Total Revenue)
ACoS focuses on paid sales efficiency, while TACoS evaluates the overall effect of ads on total revenue.
A low TACoS indicates strong total revenue growth, whereas an increasing TACoS suggests over-reliance on ads.
Cost-Per-Click (CPC)
CPC (cost per click) is the price you pay for each ad click, reflecting keyword competitiveness and your bidding strategy. Lowering CPC while maintaining quality clicks is crucial for optimizing paid campaigns.
Tracking CPC
You can monitor CPC over time by viewing the average cost of clicks across keywords and product pages.
![]()
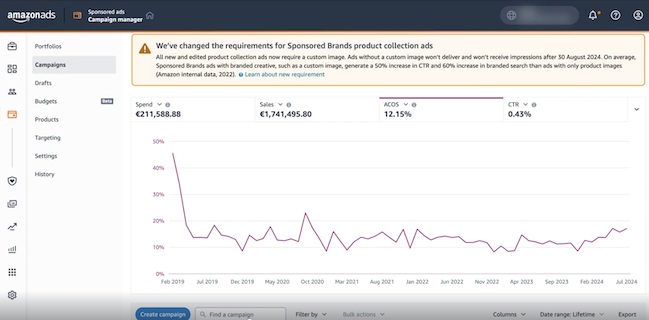
Click-Through Rate (CTR)
CTR (Click-Through Rate) is the percentage of clicks from impressions, showing how many shoppers clicked your ad. A higher CTR indicates ad relevance to your target audience and helps optimize placement.
To boost CTR, adjust:
- Price
- Content
- Reviews
- Fulfillment
- Ad positioning
Amazon ranks ads by revenue, so a high CTR doesn’t guarantee top search rankings.
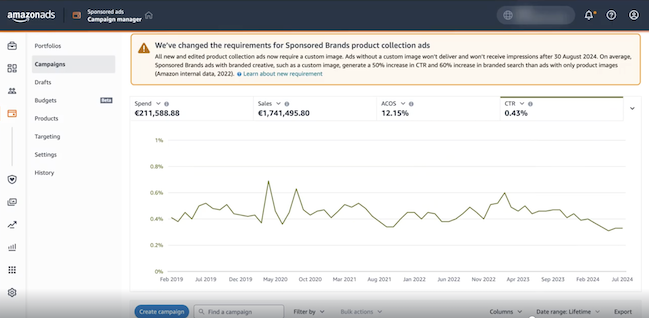
How to calculate CTR?
The simple formula for calculating CTR is:
(Total Ad Clicks / Total Ad Impressions) * 100
Aim for a CTR of 0.05% or higher; a CTR below 0.03% suggests ineffective keywords.
How to Track Performance
Other metrics to watch in the Amazon Ads console include:
- Clicks: The number of times a shopper clicks on your ad. This indicates how engaging your ad is and how well it drives traffic to your product listing.
- Conversion Rate: The percentage of users who take a desired action, such as making a purchase, after interacting with your ad. It measures the effectiveness of your ad in driving conversions.
- Impressions: The number of times your ad is displayed to a shopper. This helps assess your ad’s visibility and the potential reach of your campaign.
- Return on Advertising Spend (ROAS): The ratio of revenue generated to ad spend. It shows how much revenue is earned for every dollar spent on ads.
- Sales: The total number of units sold through your ad. This metric measures how well your ad converts clicks into sales.
Launch optimized campaigns and leverage automation to keep them optimized over time. Easy to use for any Aamazon seller.
Get started